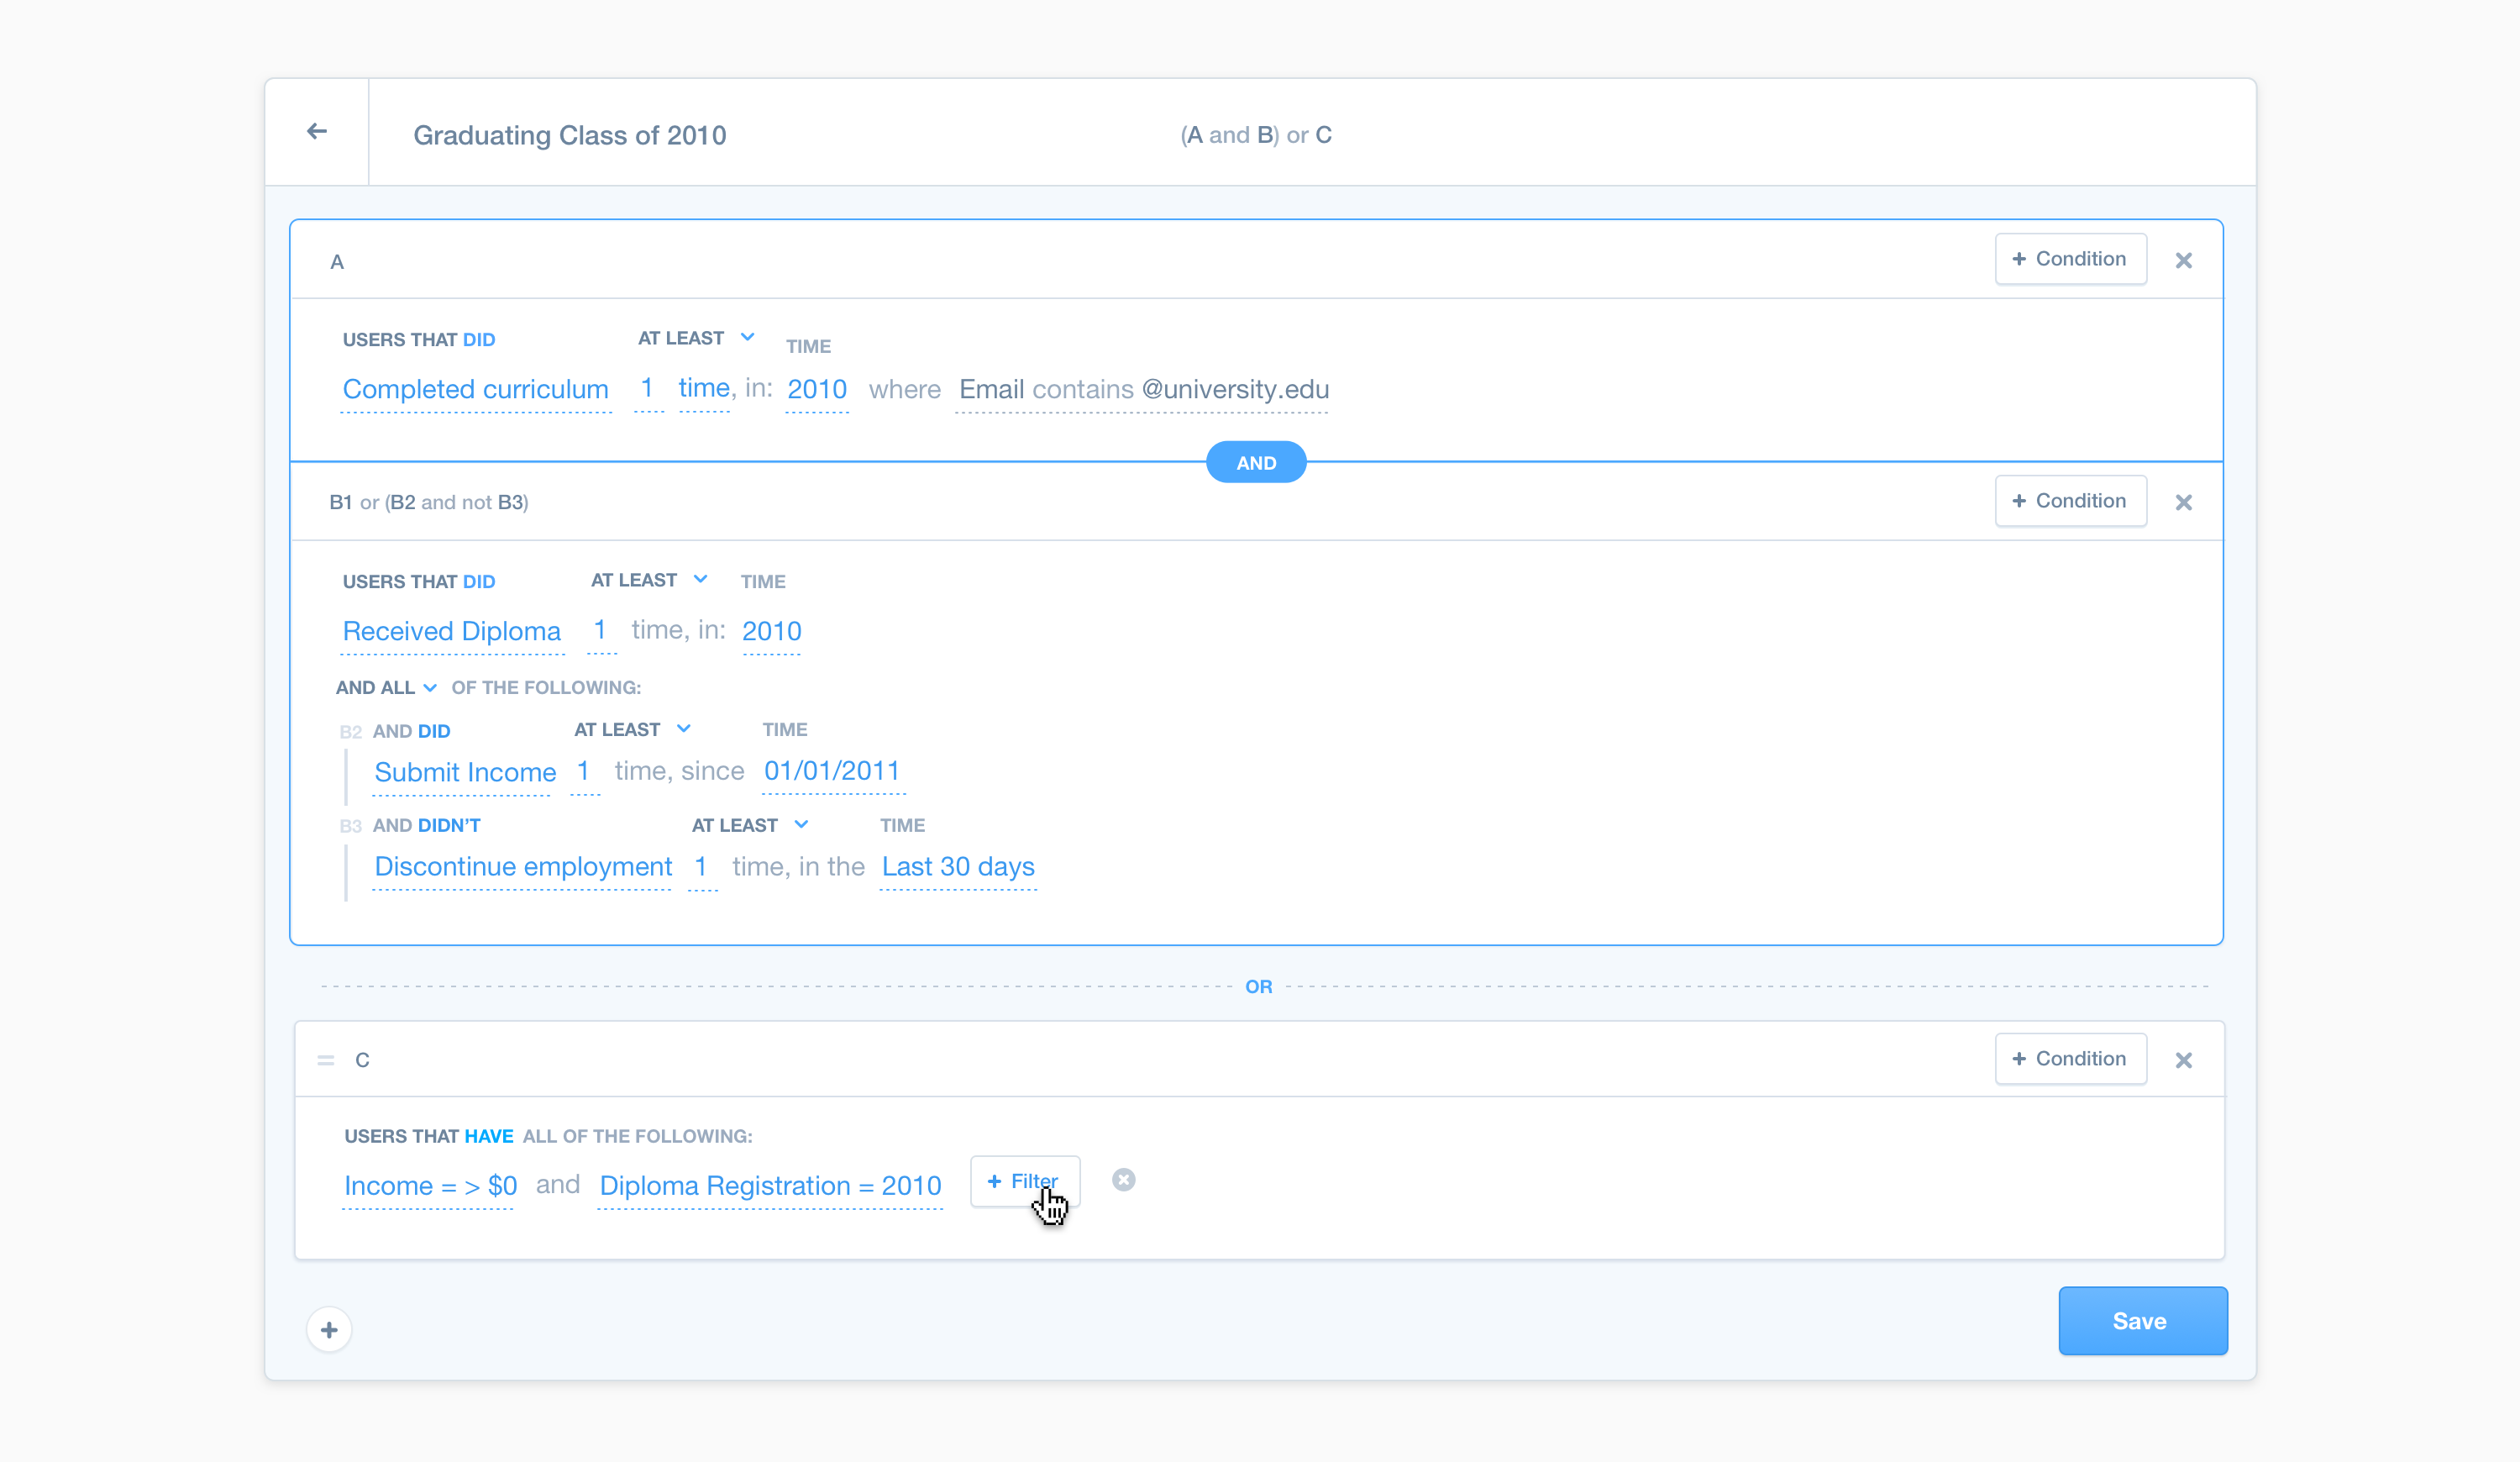
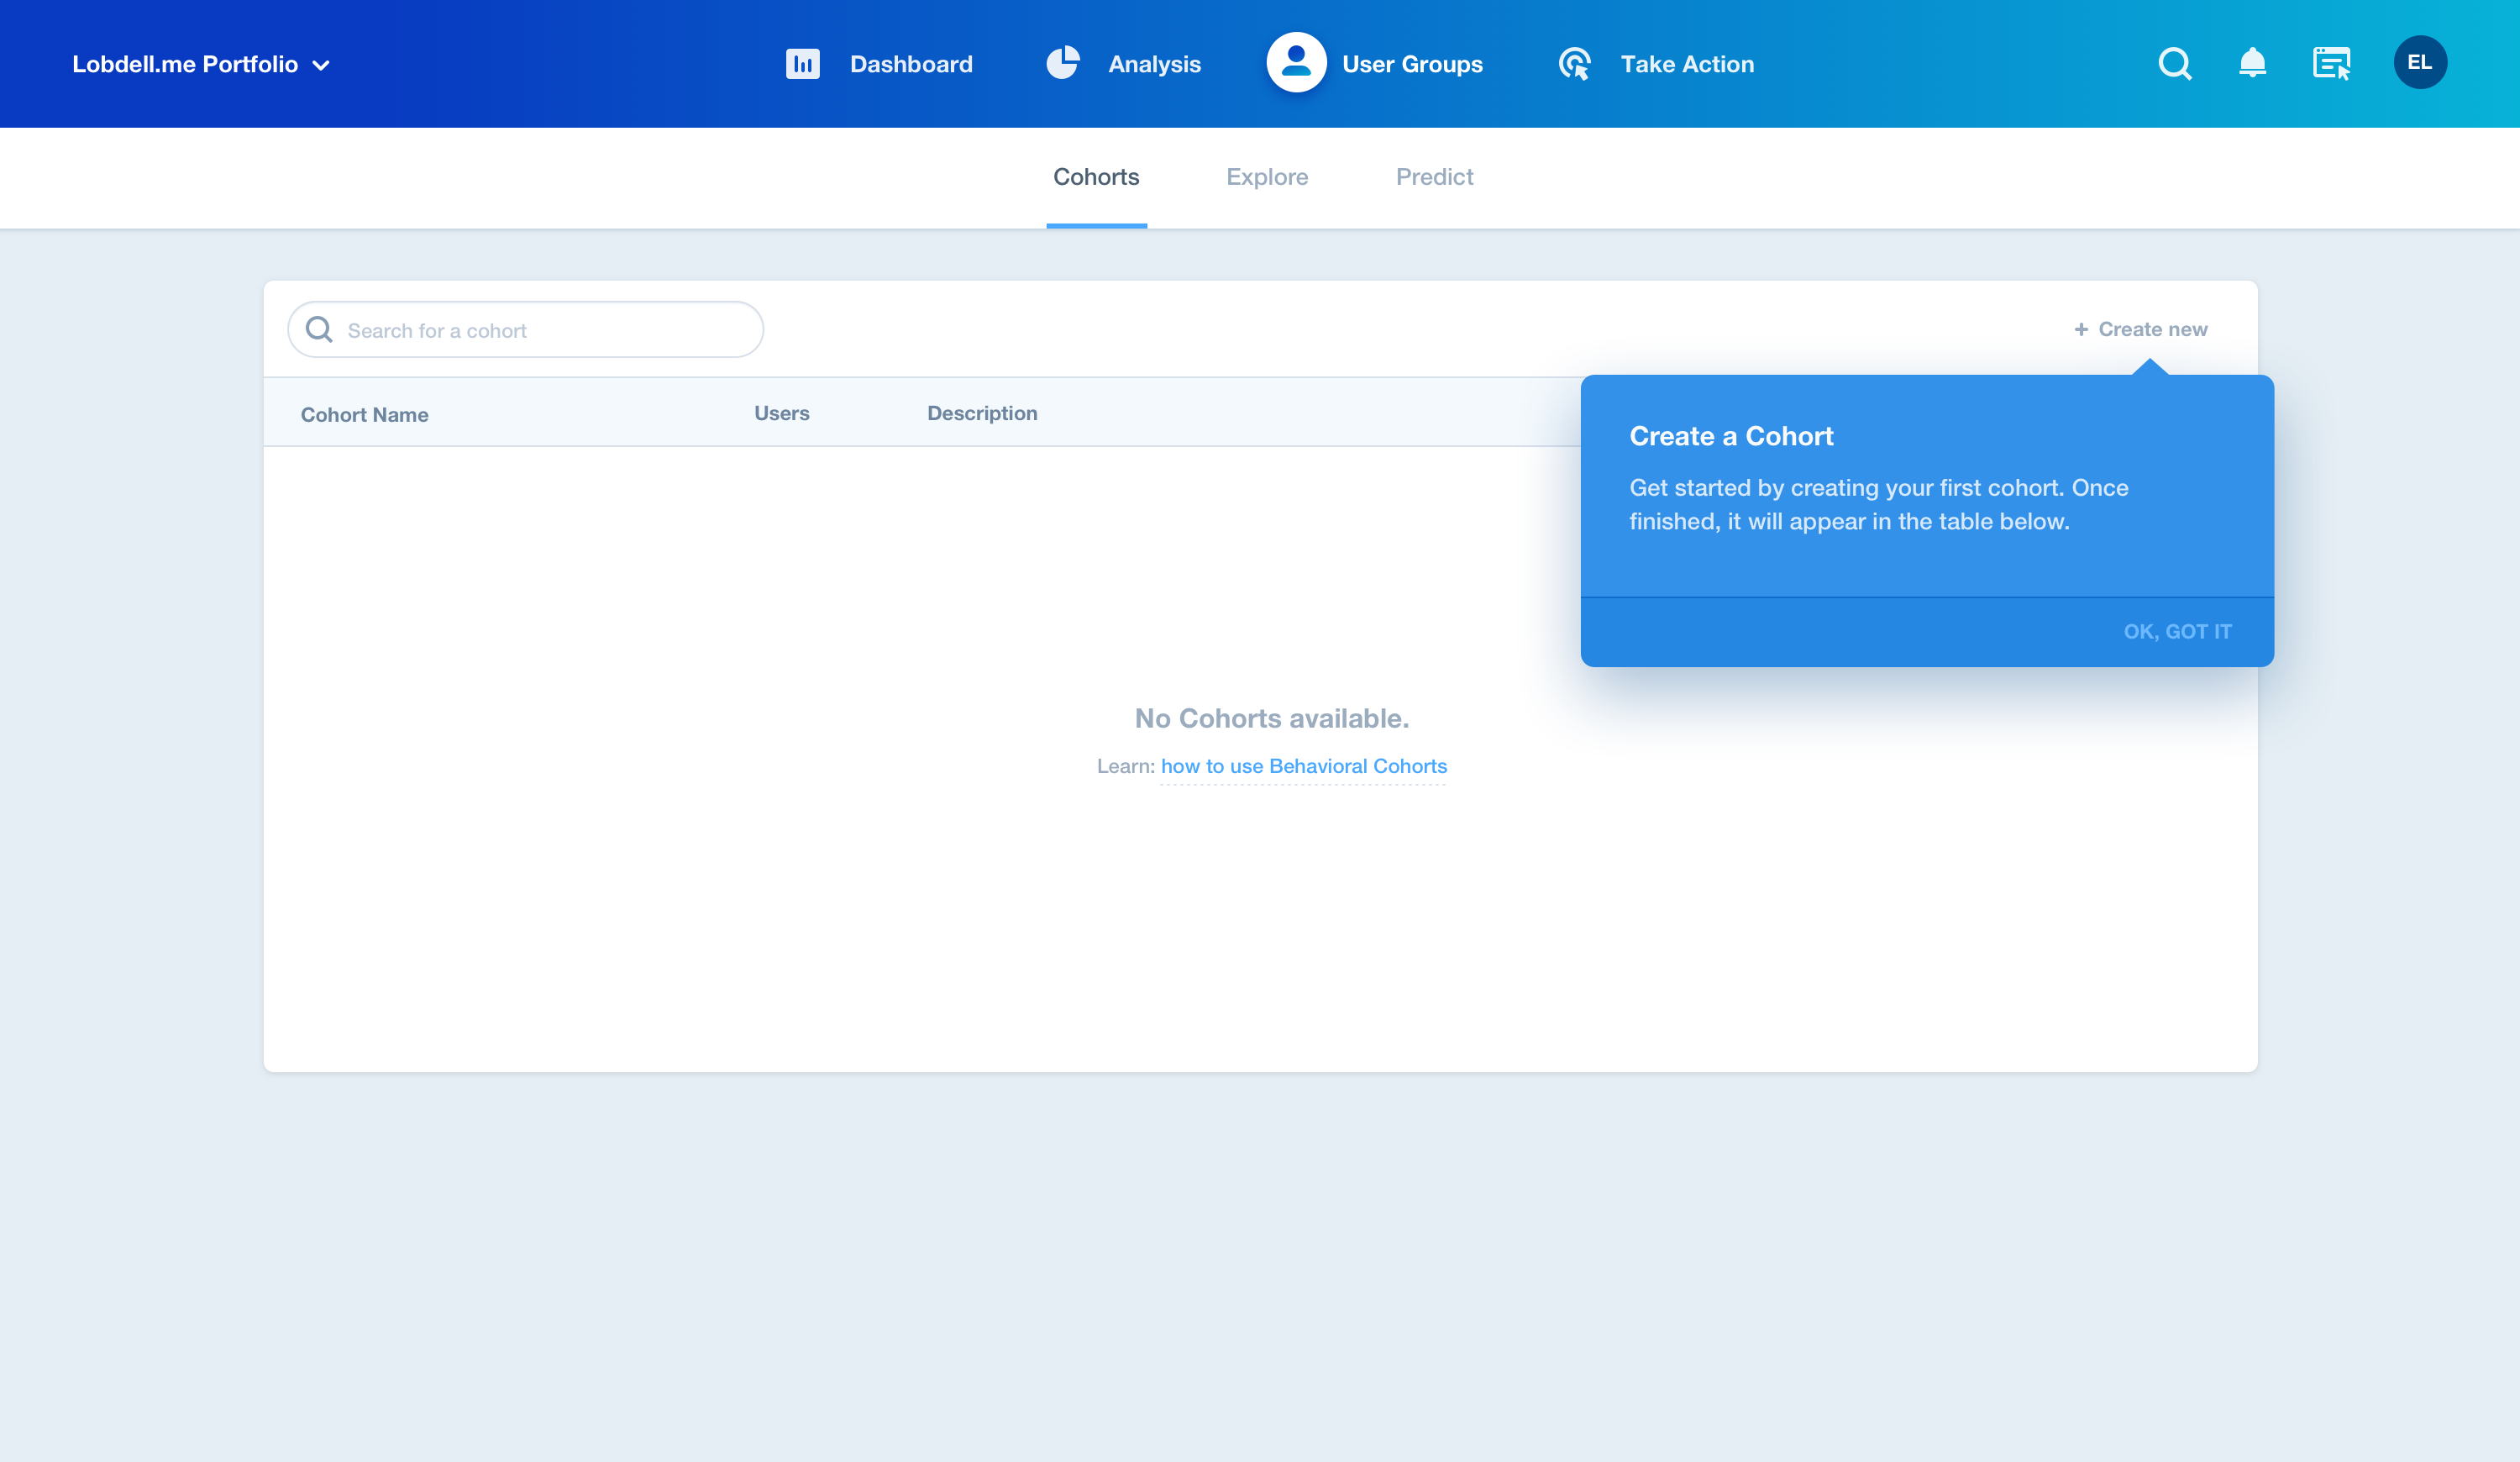
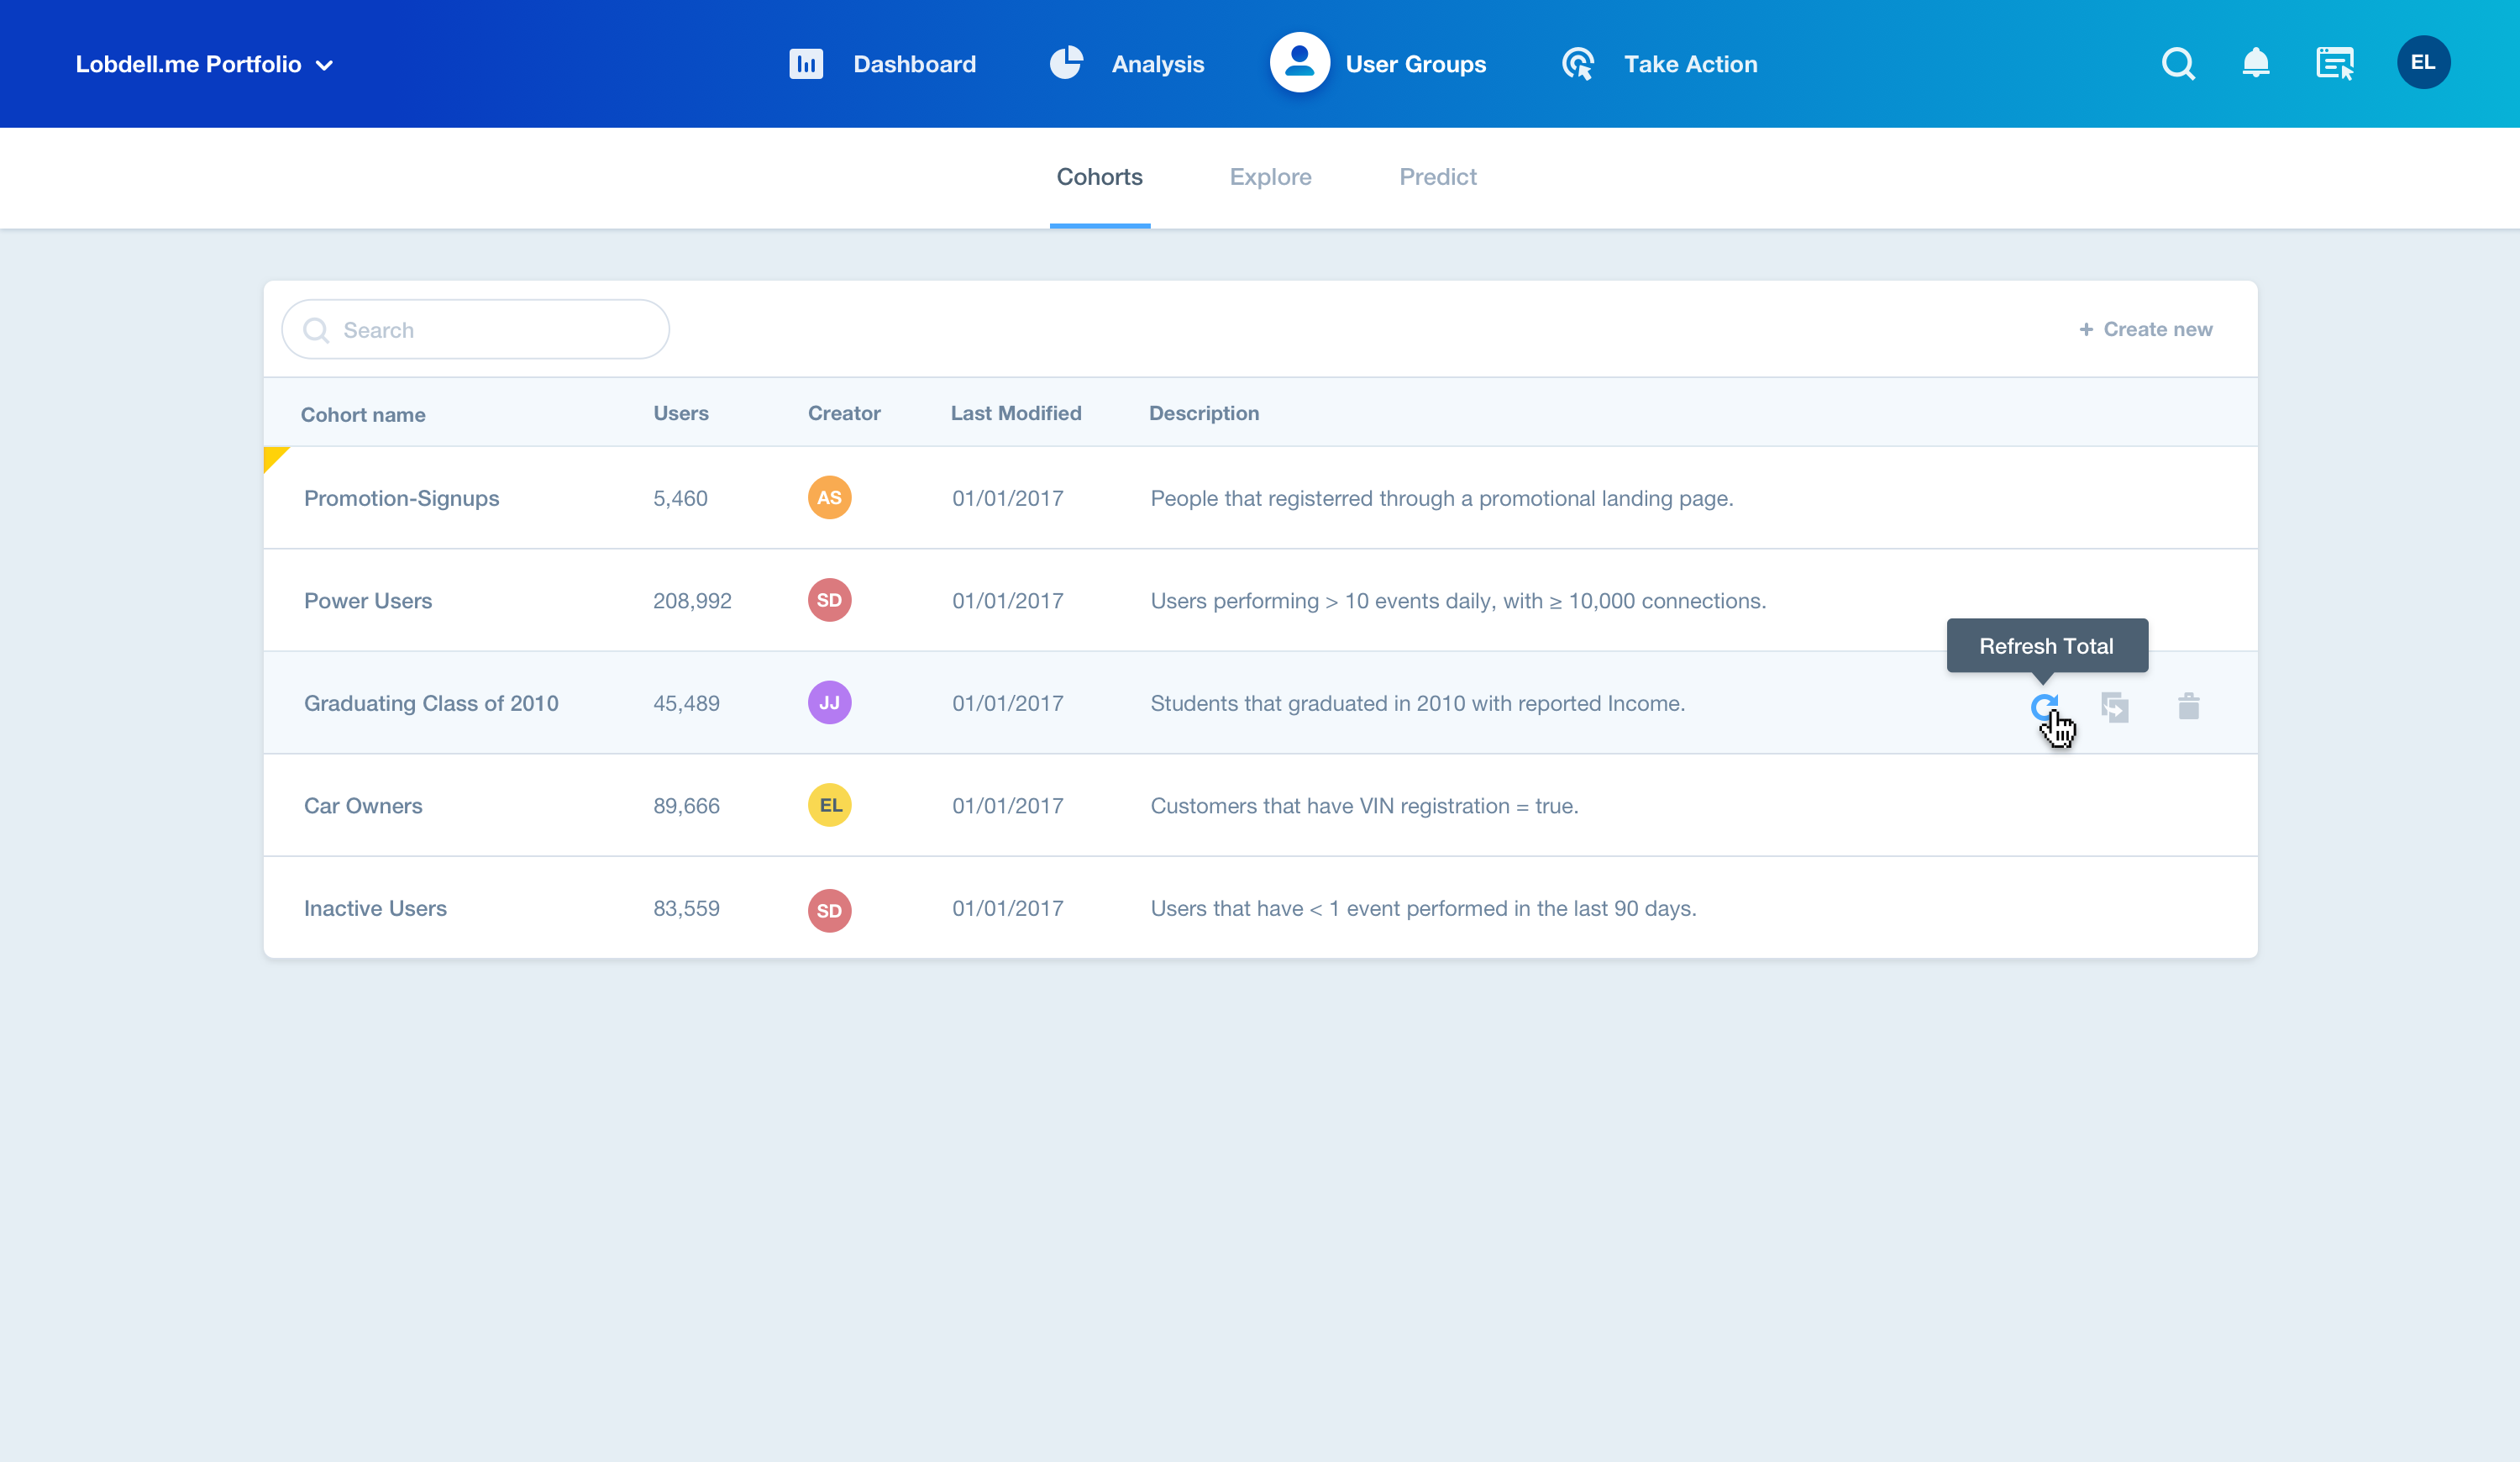
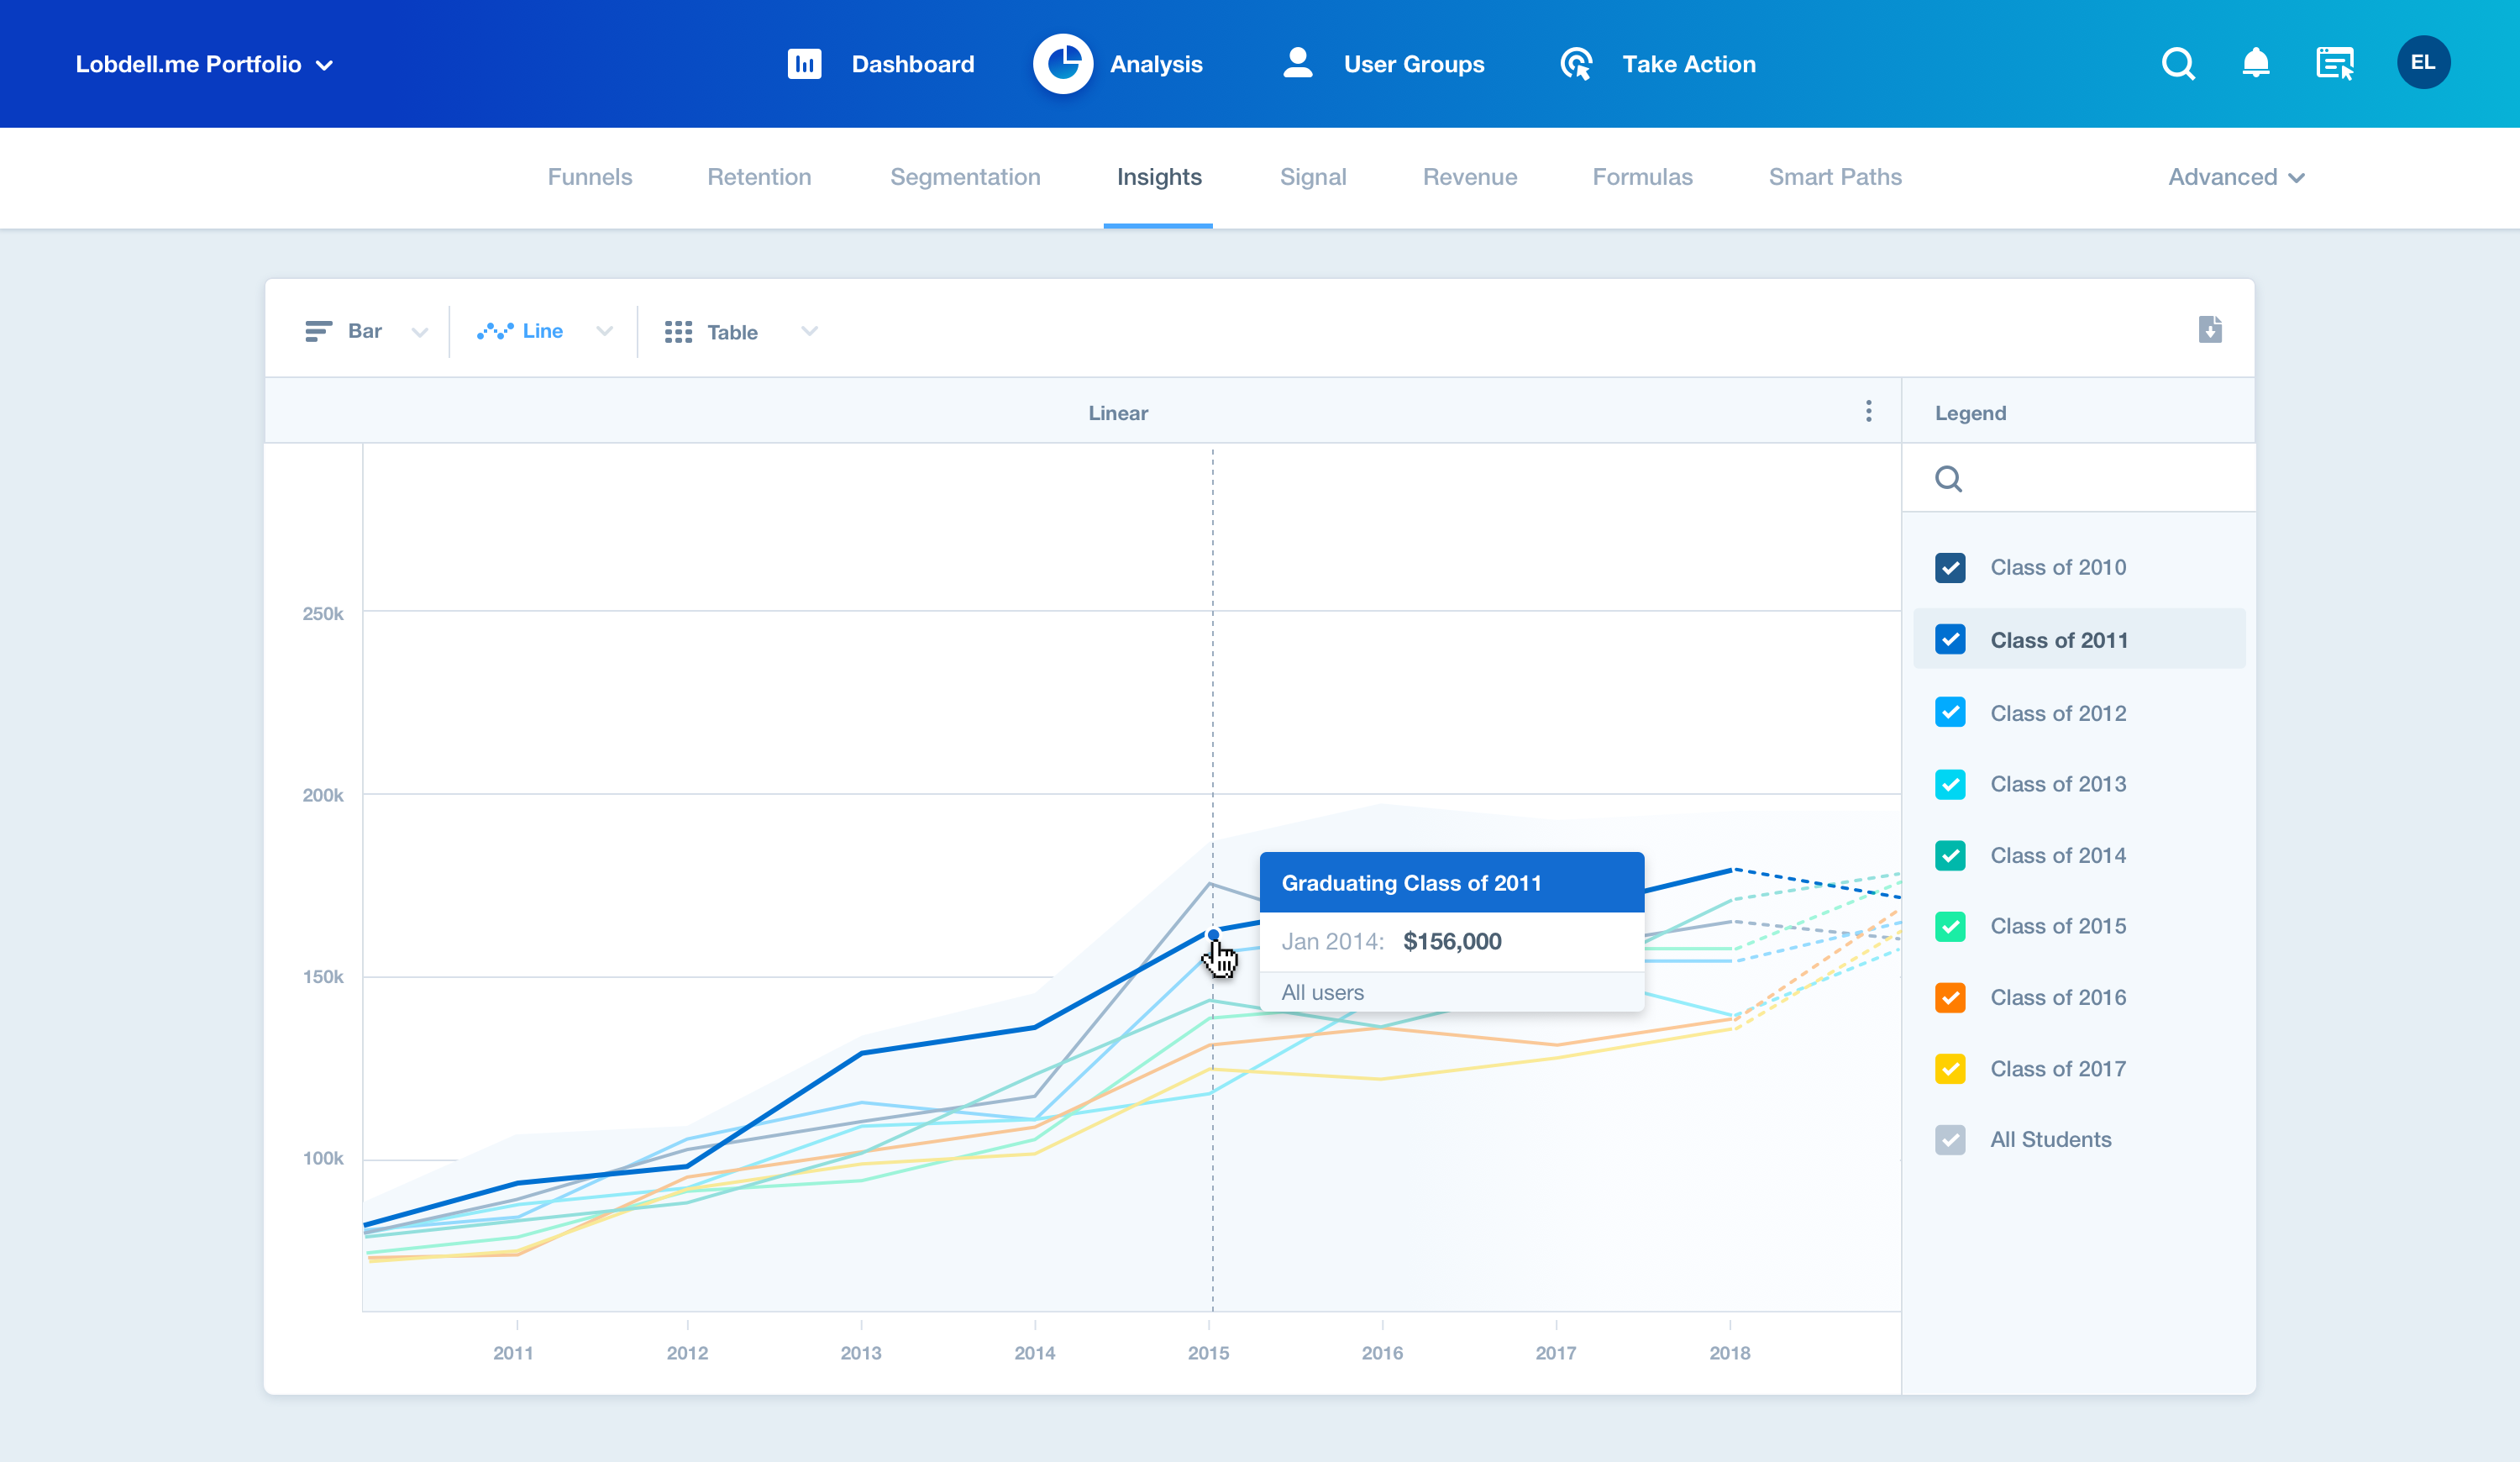
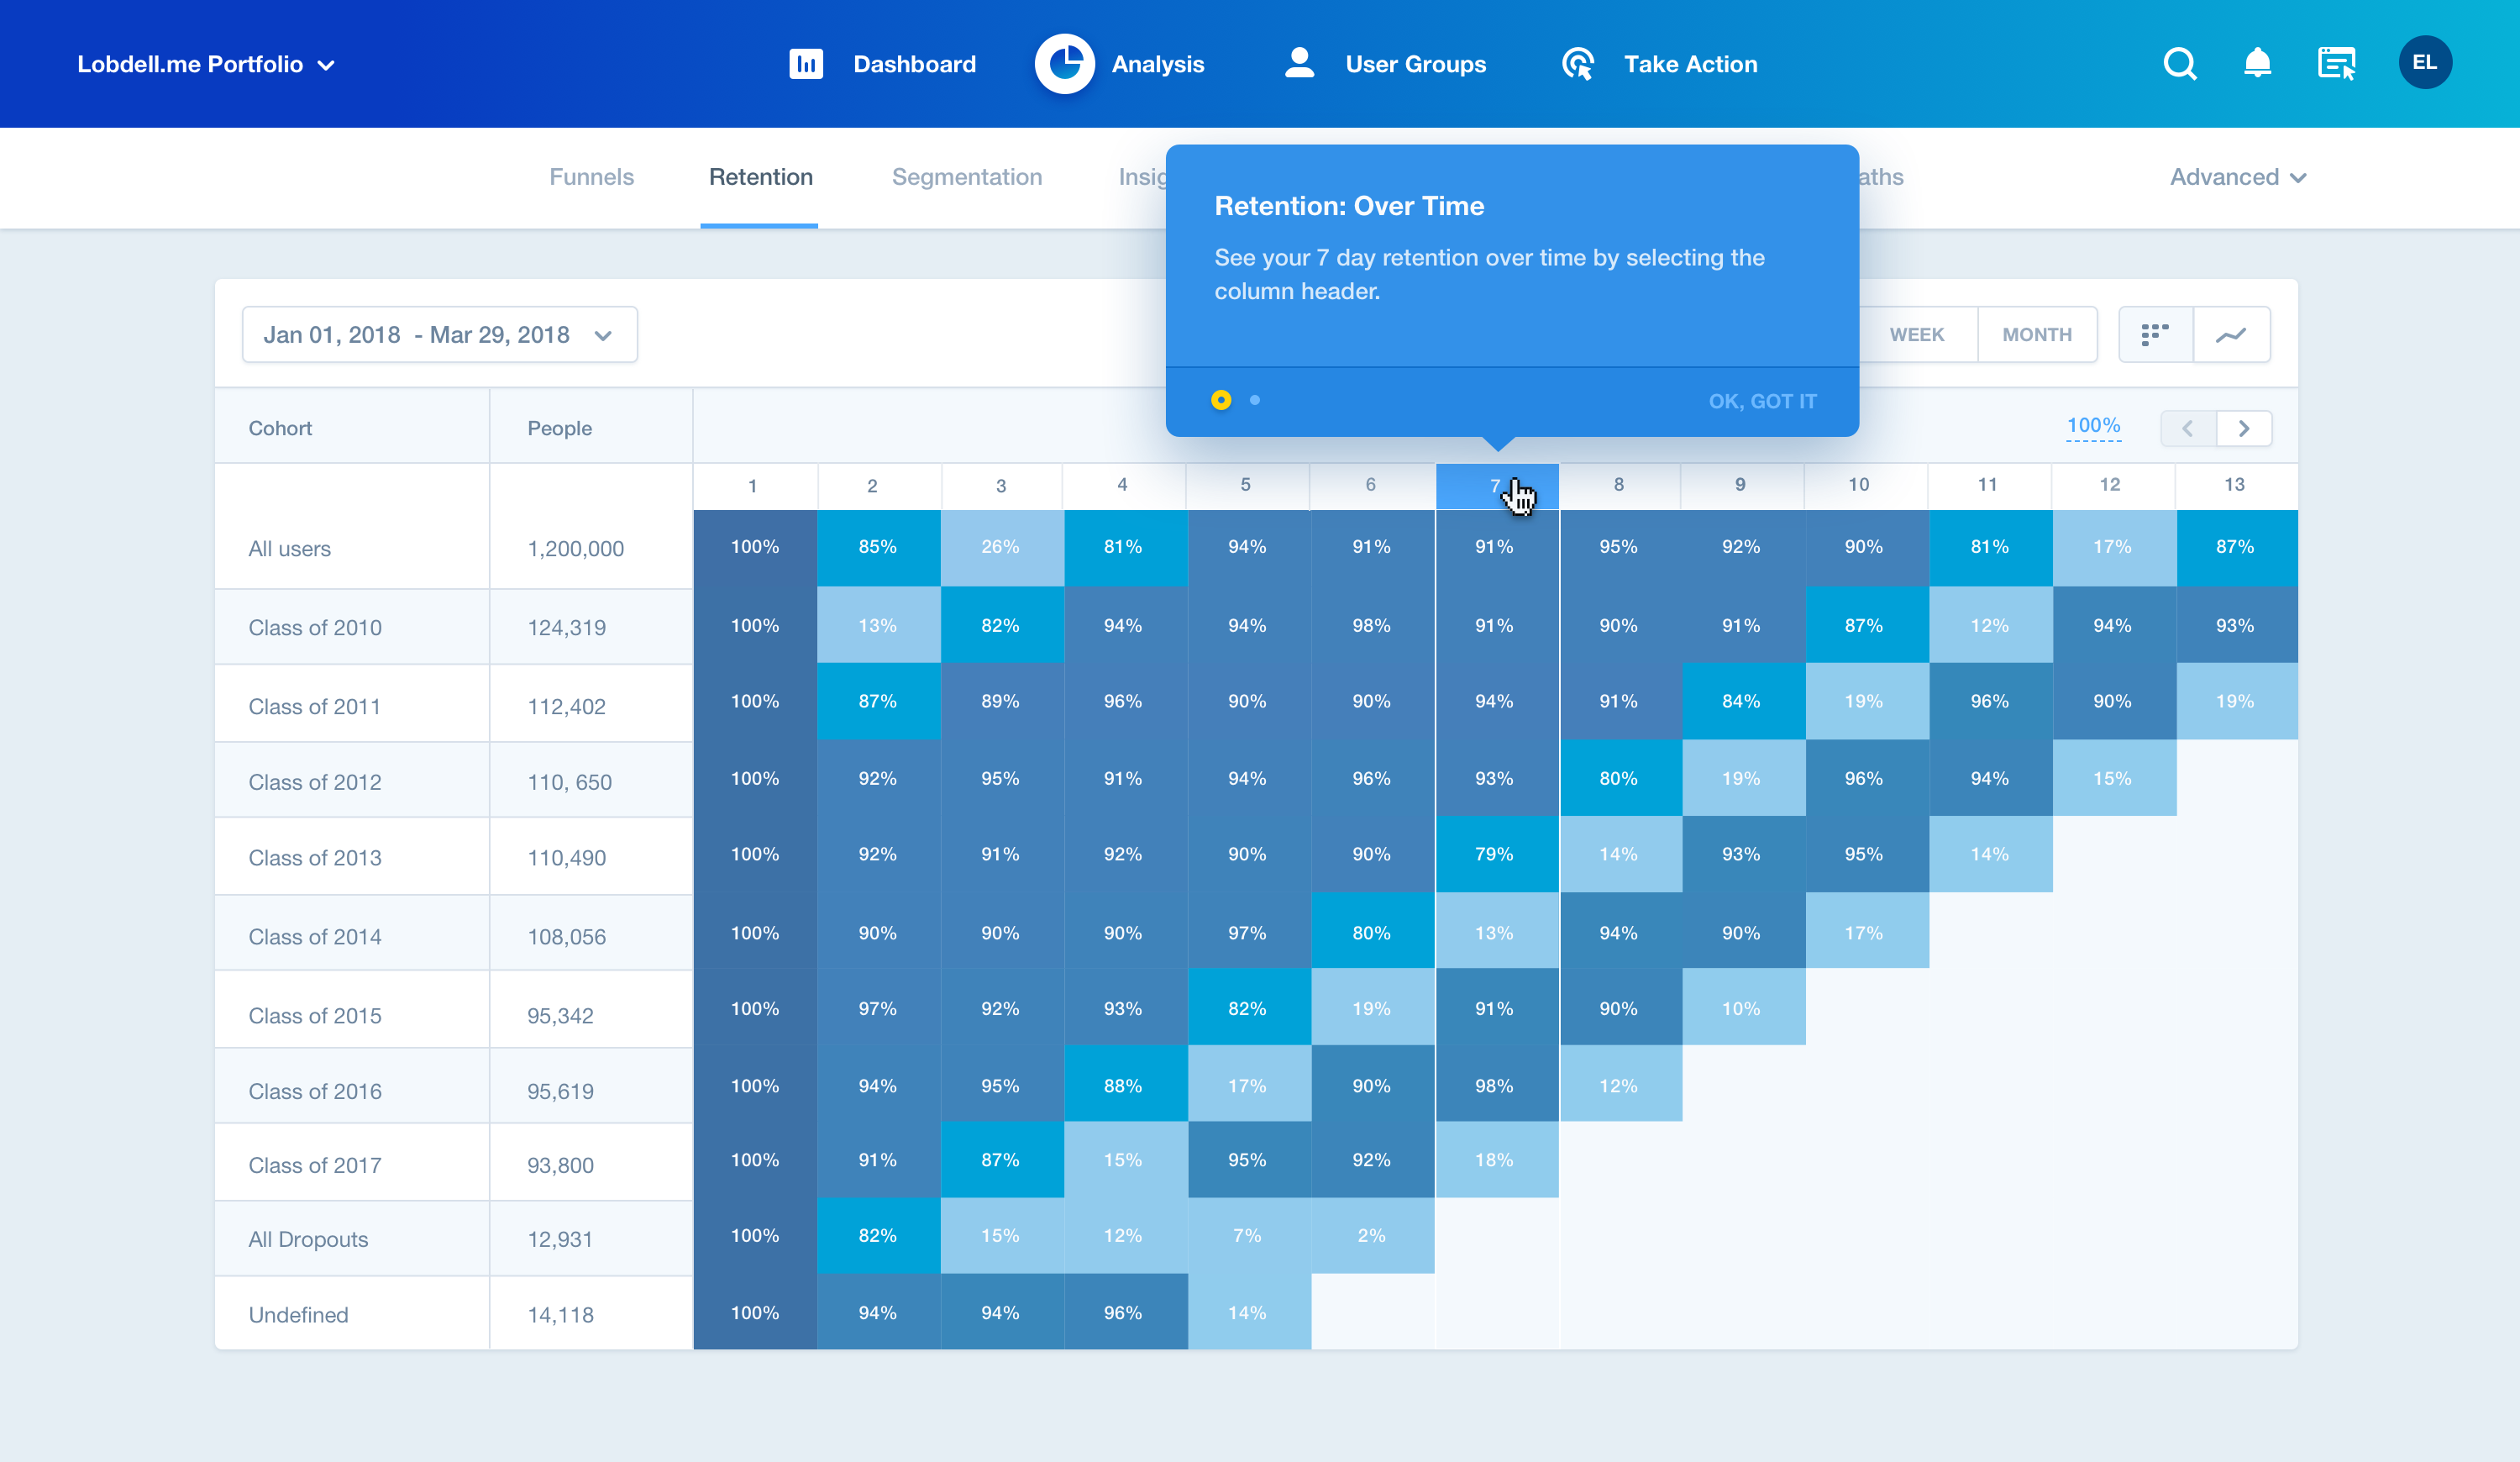
Cohort analysis allows you to compare groups of users that are defined by shared characteristics. These can be things like: graduation date, geographic location, or performing a specific event. By defining these cohorts, you can analyze the their activity over time. For example: If you wanted to determine the average income for the graduating class of 2010, compared to all other graduates, you'd start by defining a cohort of users that graduated in 2010. You can read more about how to use Cohorts via the Mixpanel Support Documentation.
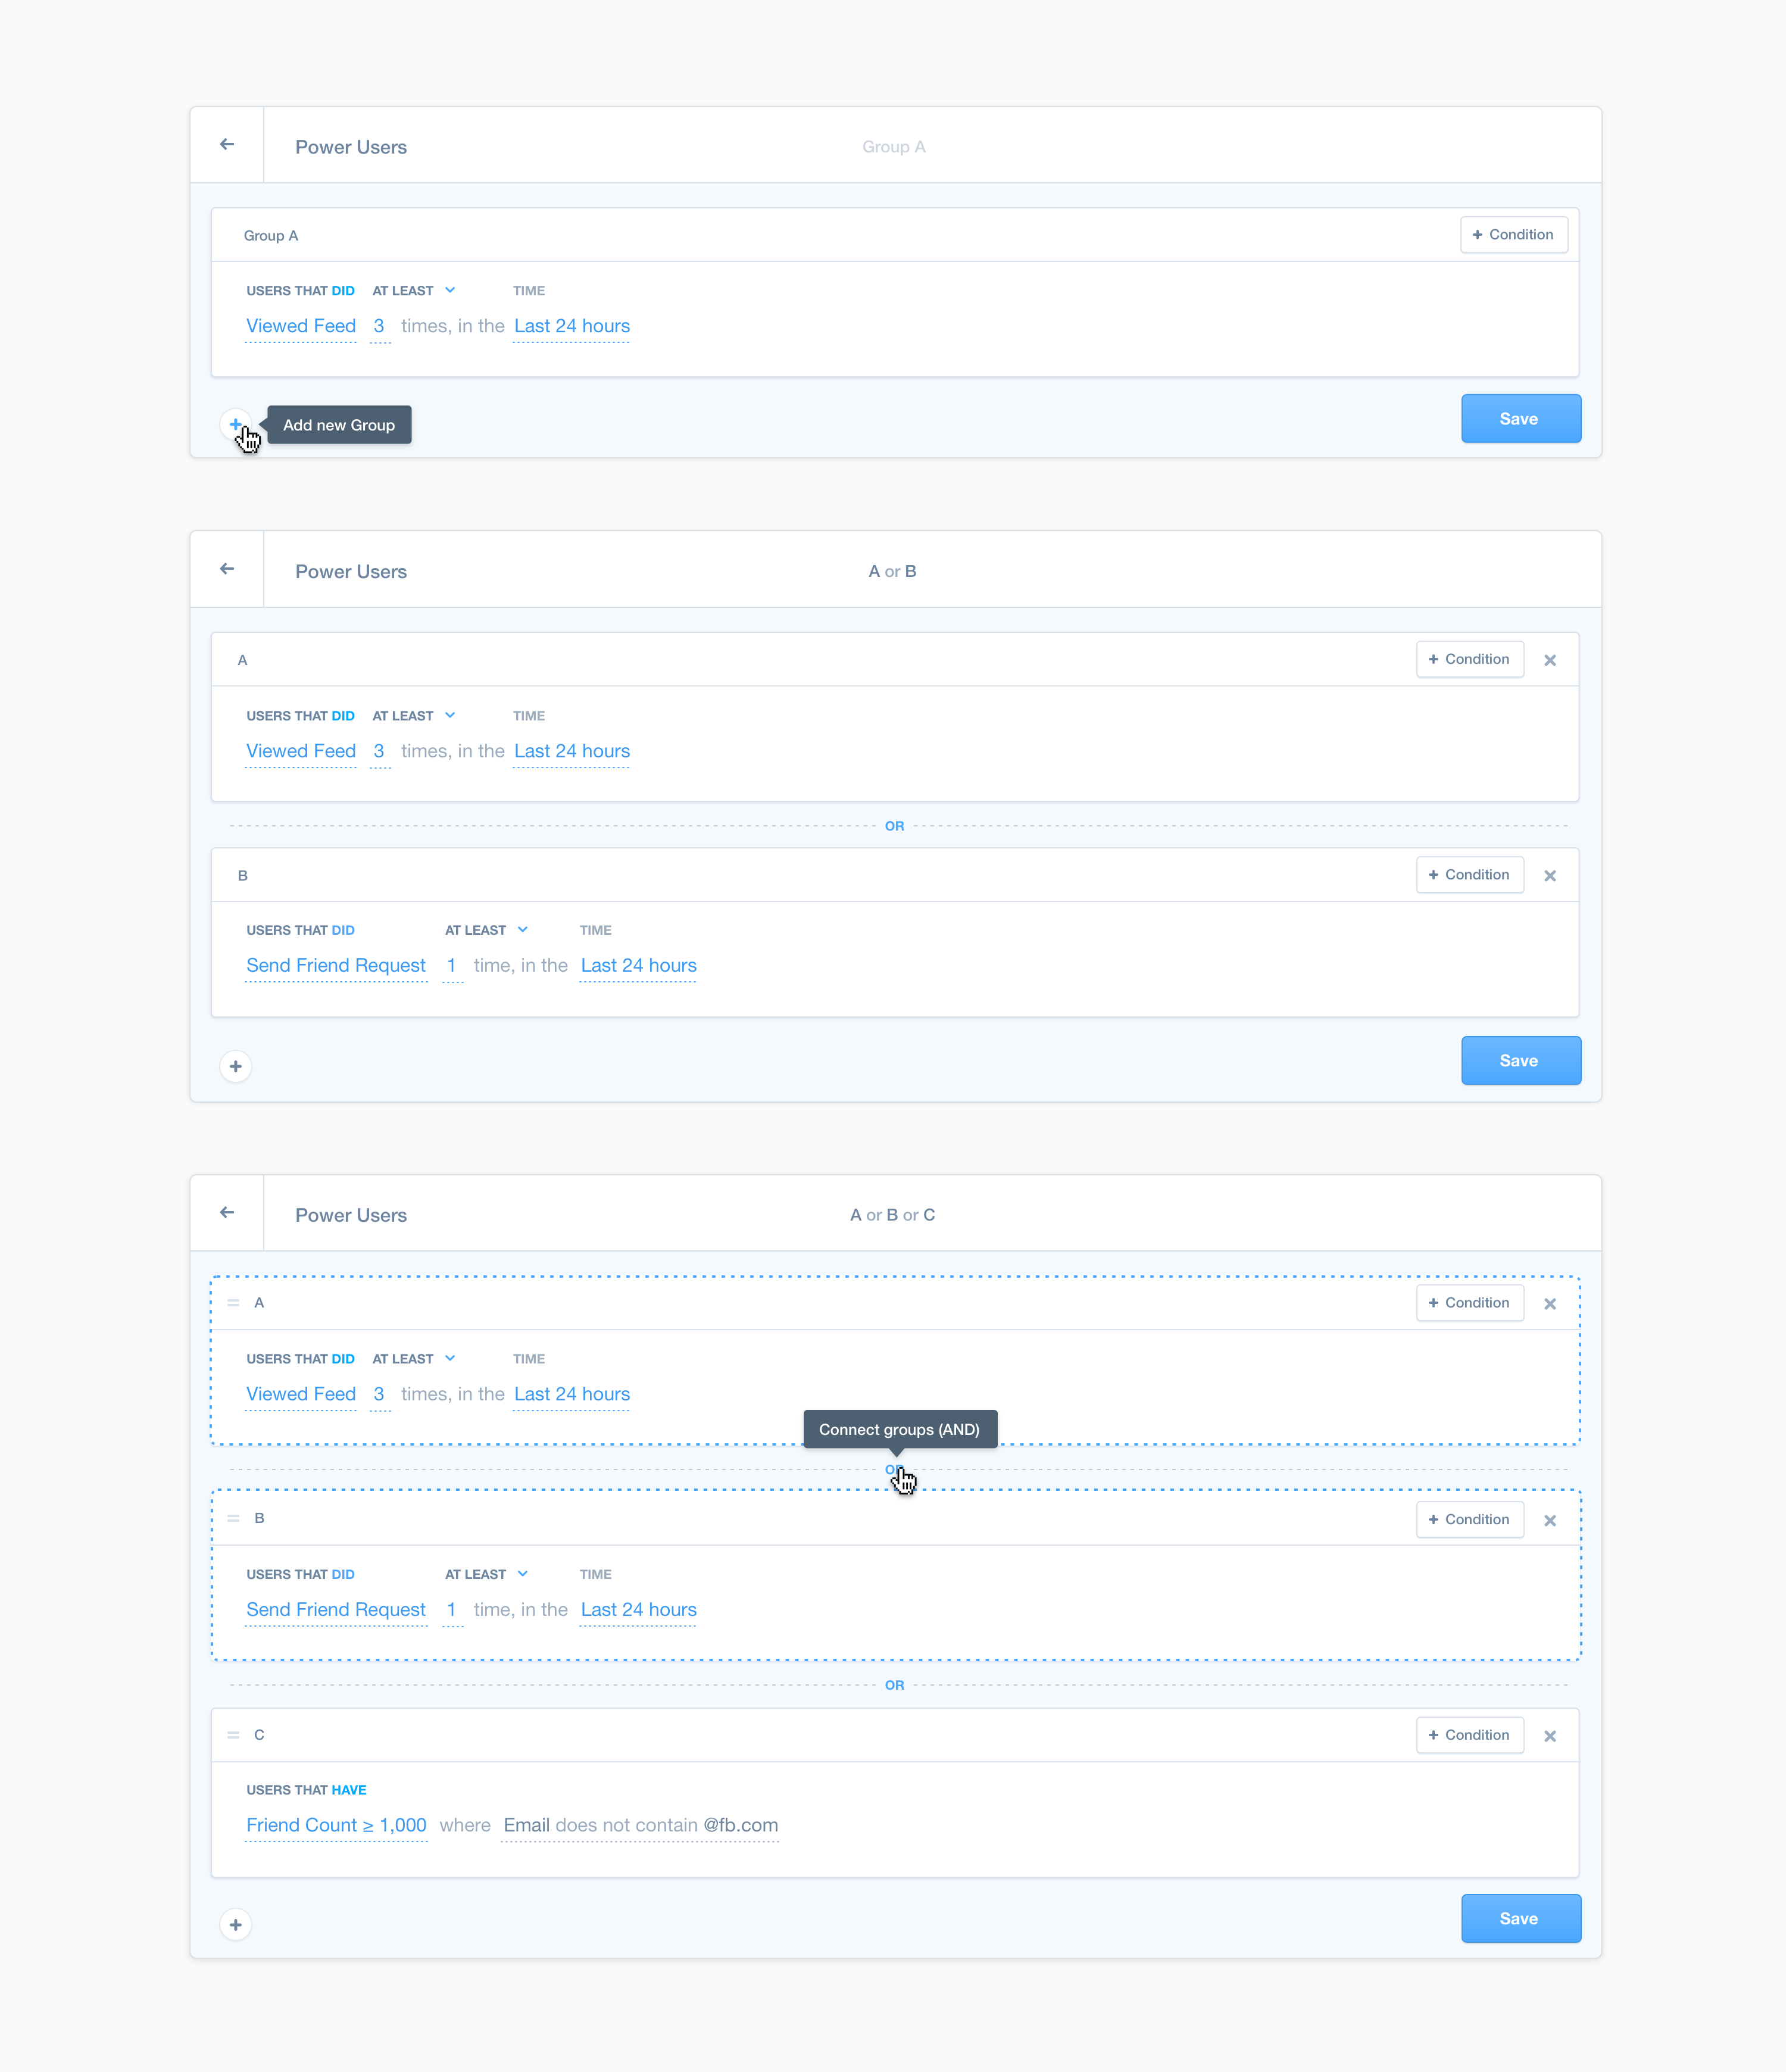
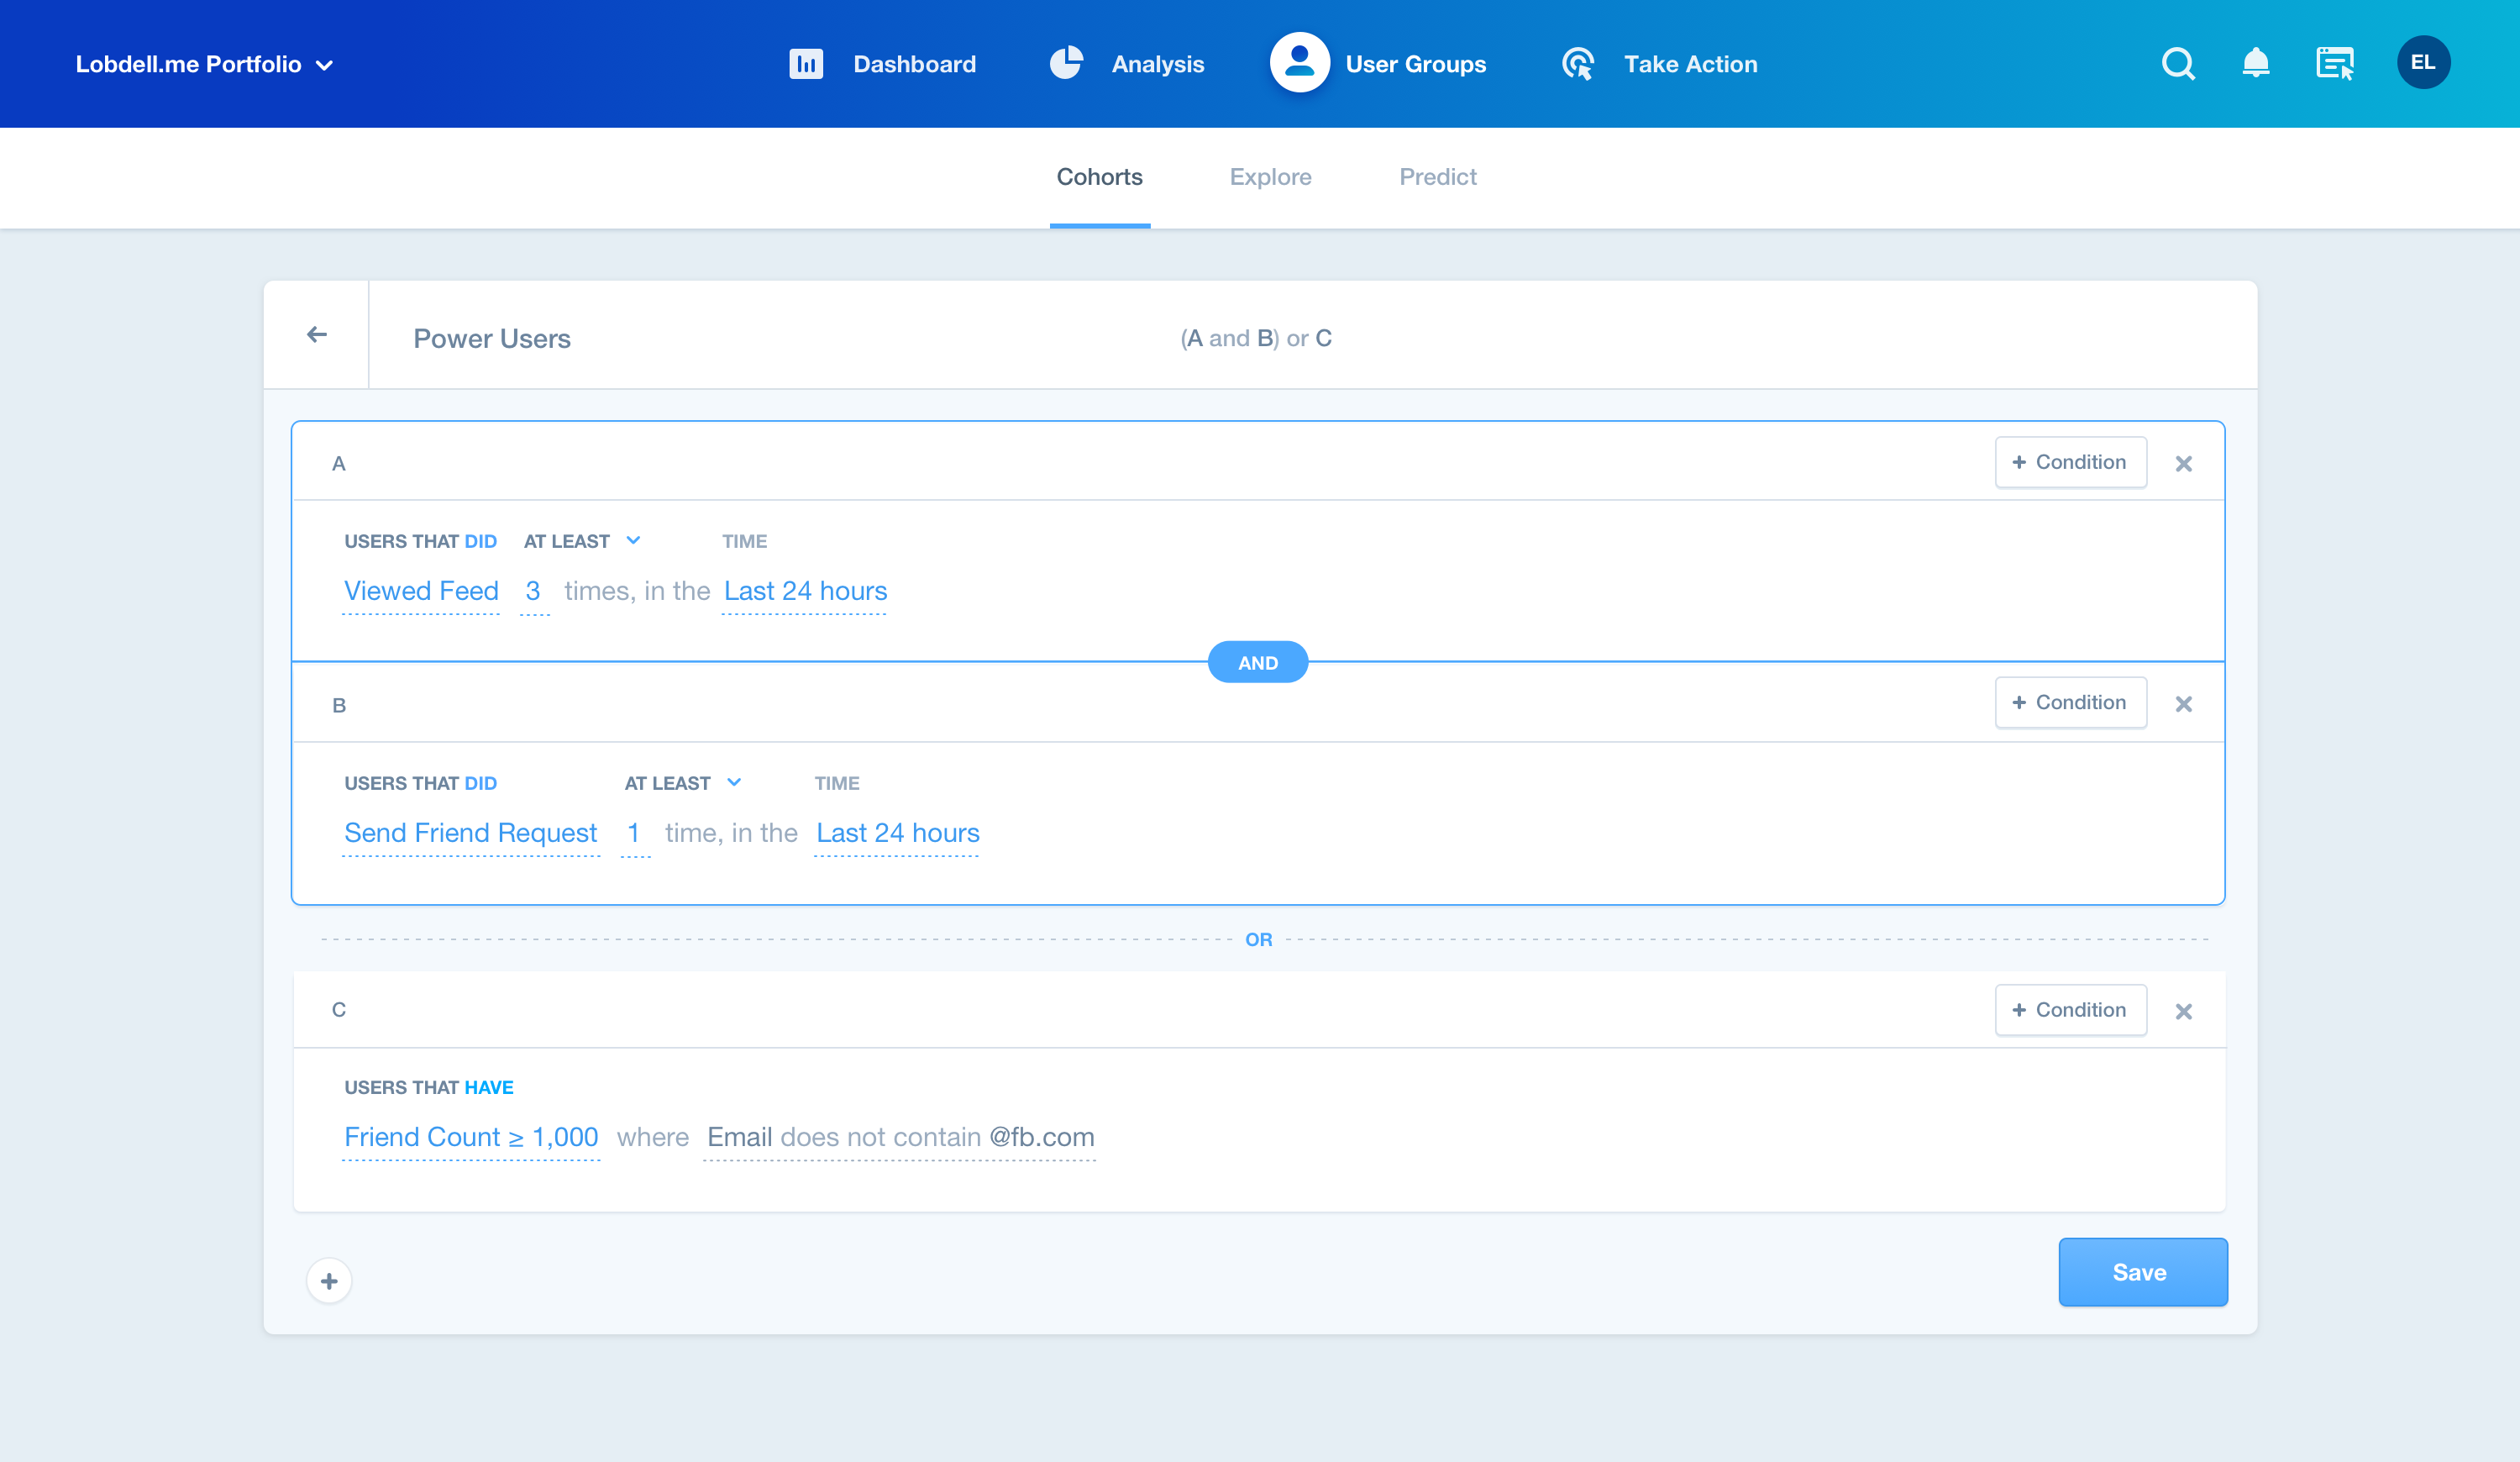
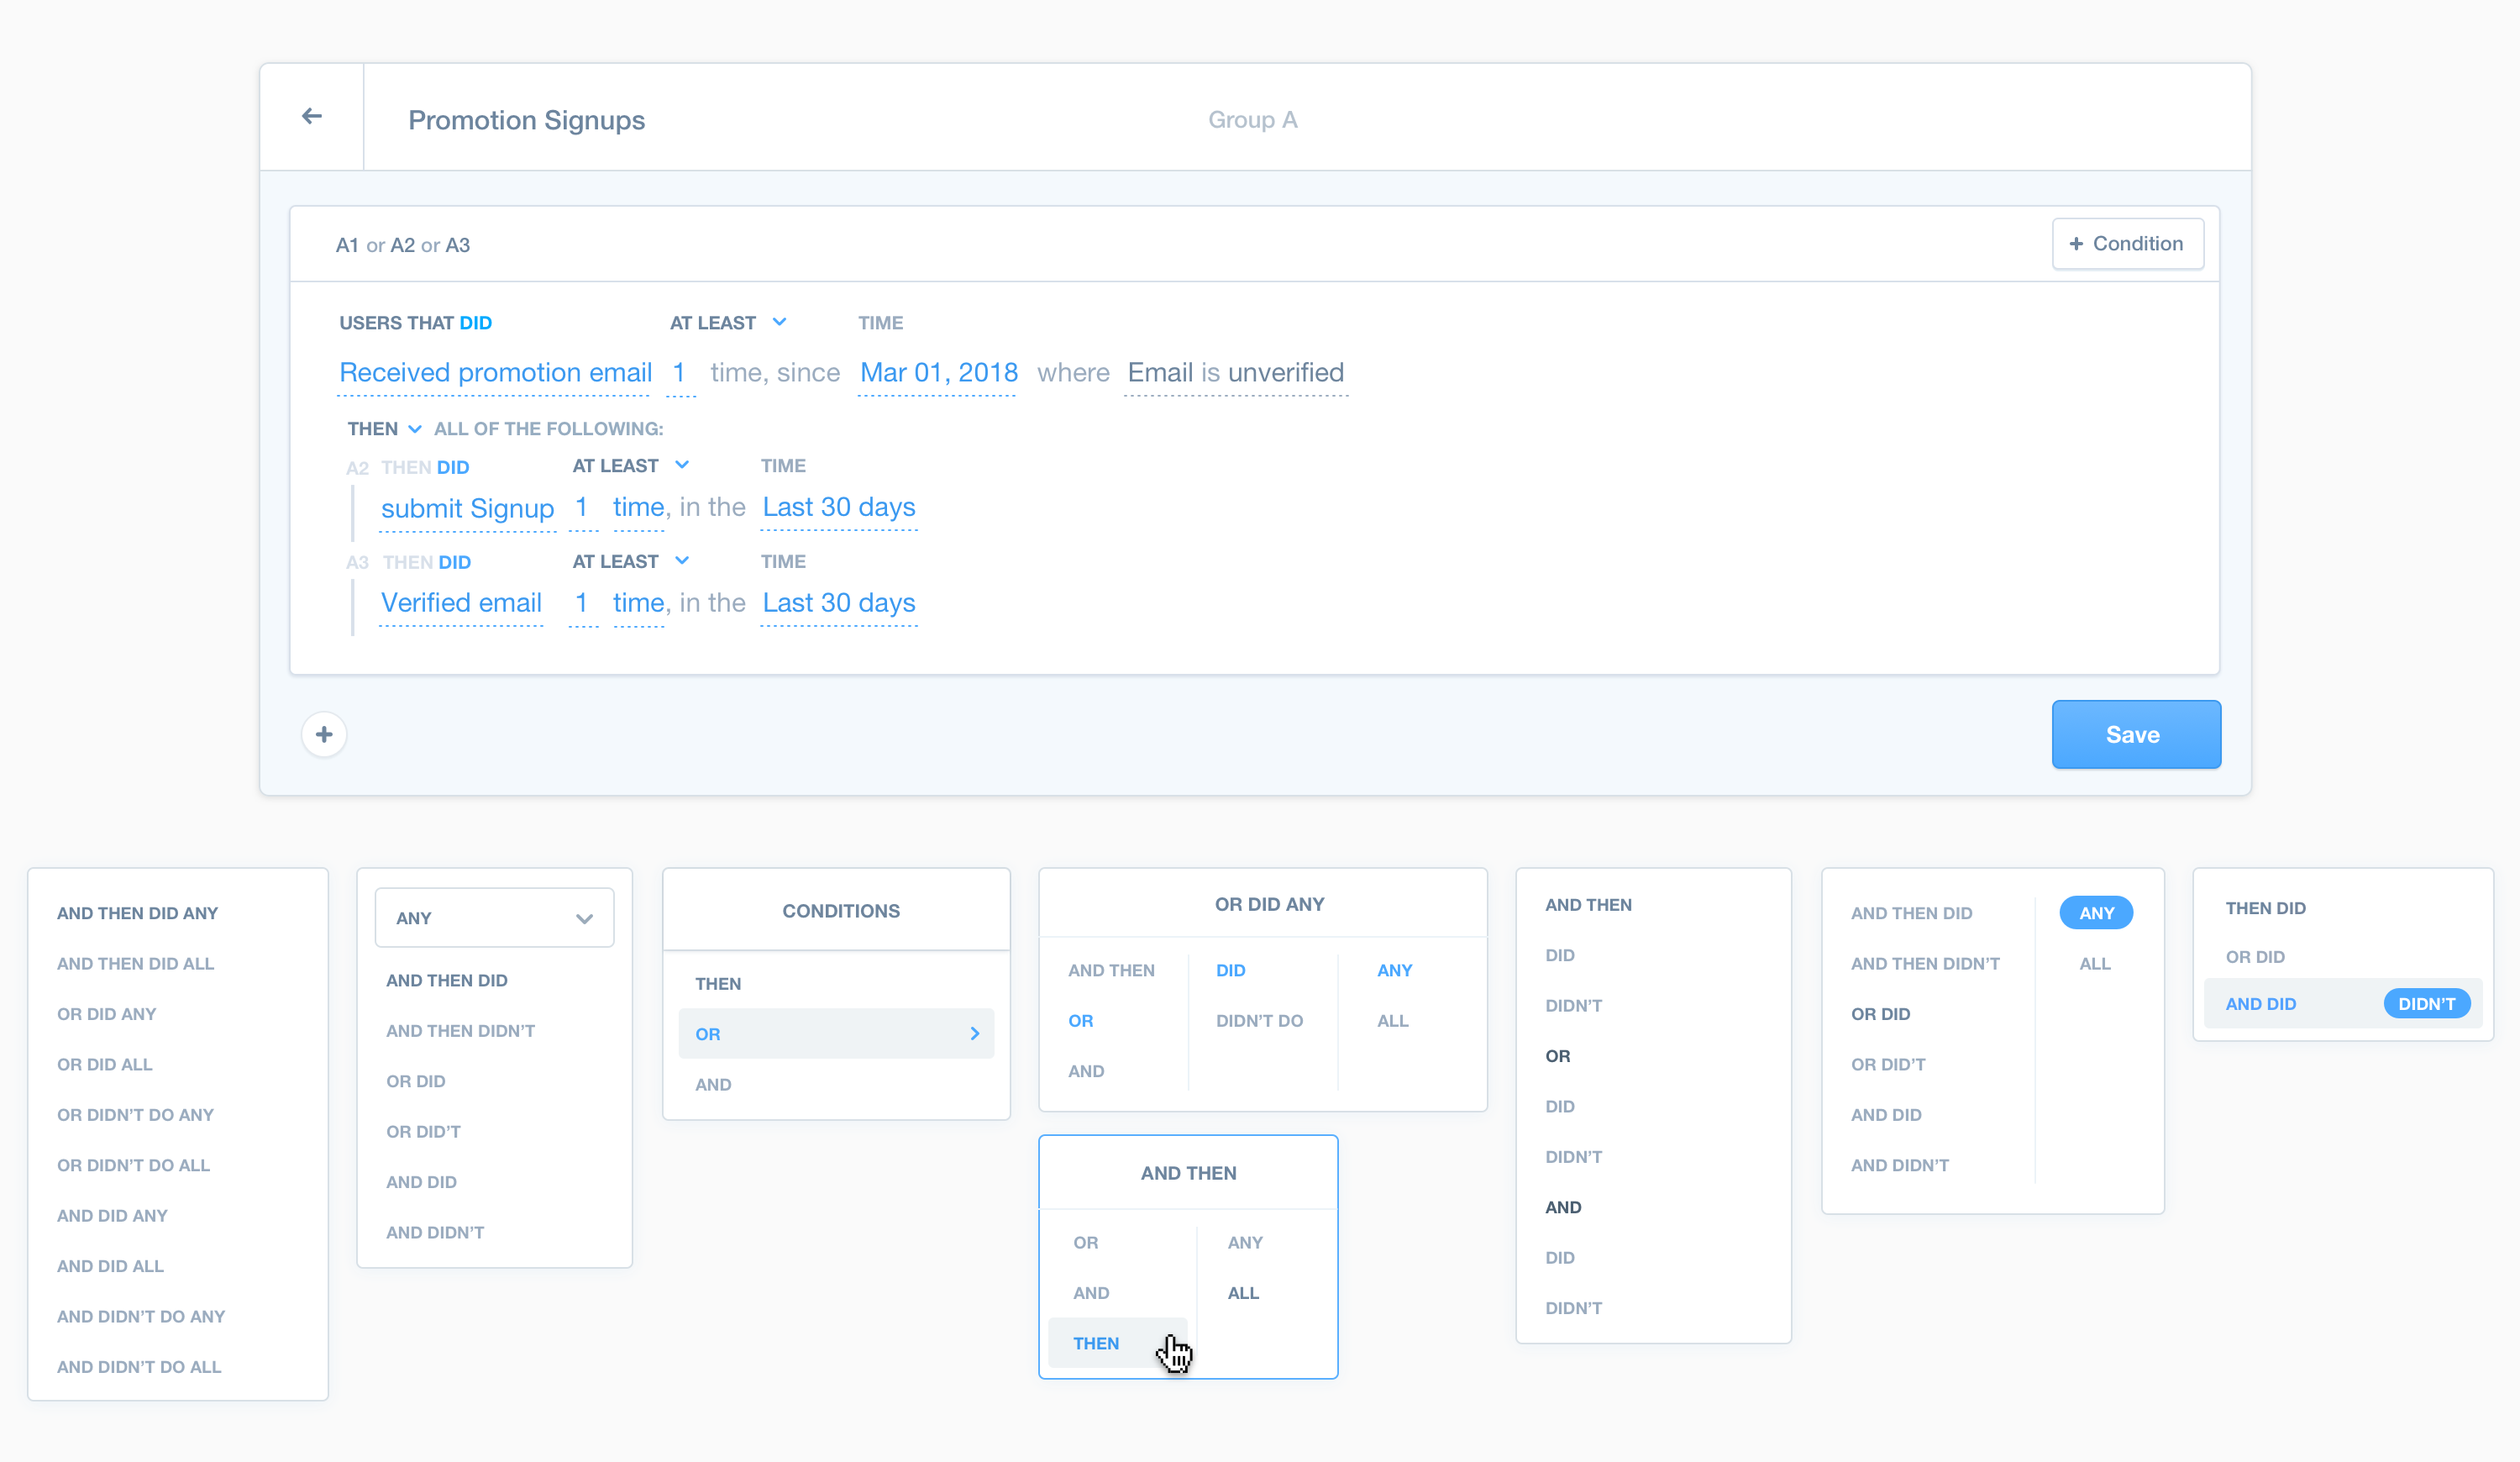
The challenge with this project was to create a tool that allows users to define a cohort that can be used within other Mixpanel reports. The final solution allows you to define which specific Events and Properties that would qualify users to be included in a cohort. You can even string together a series of events that must be performed in order (a funnel), for example: users that received a promotional email, logged in, and completed a purchase within 24 hours.
